
Have you ever noticed how certain patterns tend to repeat over time?
The call center is always busier on Mondays. You feel more tired every January. The pool gets crowded on weekends.
These observations are, in their own way, small forms of forecasting: you recognize a pattern from the past and use it to anticipate what might happen next.
In data science, this kind of intuition is called time series forecasting, the ability to use historical data to estimate future values. It’s like saying, “If sales have always increased before Christmas, what should I expect this year?”
Time Series: definition
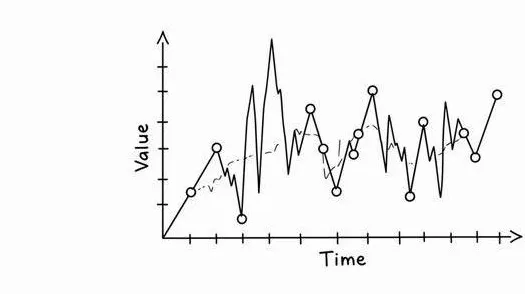
A time series is simply a set of data collected at regular time intervals: each point represents a specific moment and is connected to the one before and after it.
It could represent the trend of a stock price, daily visits to a website, or the number of pizzas sold in a restaurant.
The key element is that the order of time matters, you can’t shuffle the data as you would in a normal dataset, because each value depends on those that came before it.
Every time series is made up of four main components:
Level: the average value, the base on which everything is built.
Trend: the general direction, which can be increasing, decreasing, or stable.
Seasonality: a pattern that repeats regularly (note: it doesn’t refer to the four seasons like spring, summer, autumn, winter).
Noise: the randomness, or what we can’t explain or predict.
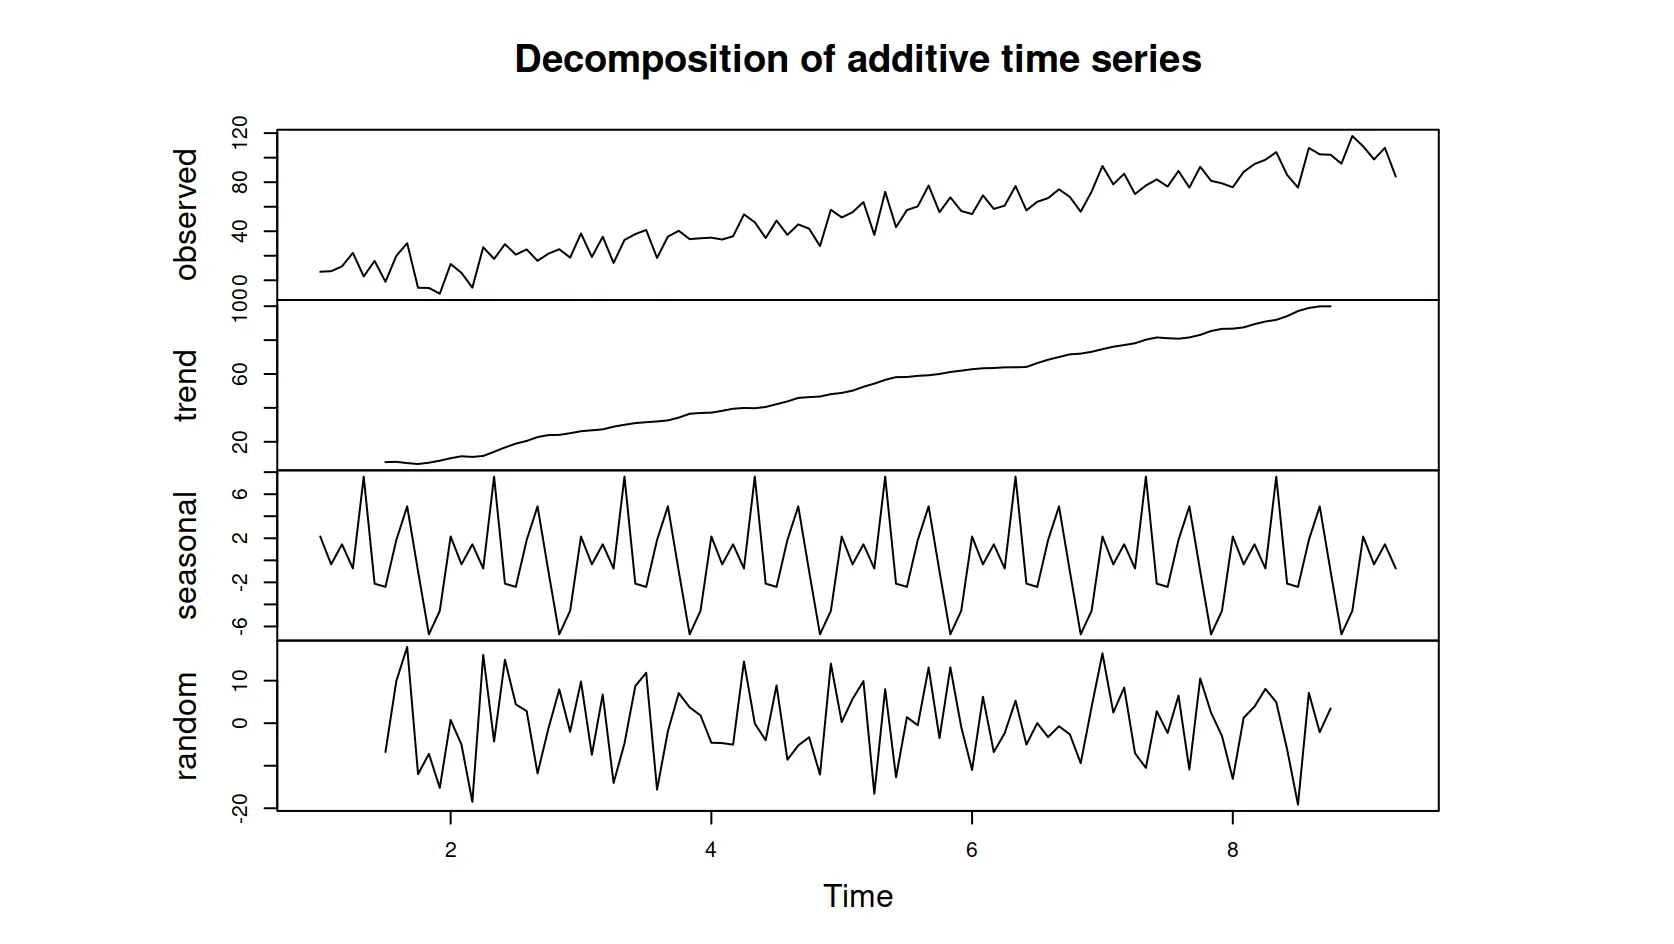
Sometimes these elements overlap, making raw data difficult to interpret. To better understand what’s happening, we can “decompose” the series and isolate each component: trend, seasonality, and noise. This process is called decomposition.
Decomposition not only helps us see the different dynamics more clearly, it also allows us to check a property called stationarity.
A series is stationary when its statistical characteristics, such as mean or variance, remain consistent over time.
Many forecasting models, such as ARIMA, are based on the assumption that the series is stationary.
If the data instead show a strong trend or shifting seasonality, we can “stabilize” them using a transformation called differencing, which consists of subtracting each value from the one before it.
This removes most structural variations, making the series more suitable for modeling.
Not all series behave the same way.
In an additive series, the variations (that is, the distance between peaks and valleys) stay roughly constant over time, for example, if every December sales increase by €1,000, the effect remains fixed.
In a multiplicative series, the variations grow proportionally, if every December sales increase by 10%, the impact becomes larger as the business grows.
A concrete example: e-commerce
Imagine running an e-commerce store and tracking sales every day.
The average level is 500 orders per day.
The trend shows that sales are growing by 5% each month, perhaps thanks to new marketing campaigns.
There is seasonality, with purchases increasing on weekends and slowing down during weekdays.
And then there is noise, such as a Wednesday when a viral post causes a sudden spike, or a Monday when a technical issue shuts down the website.
Understanding these elements allows you to forecast sales trends, plan inventory, and manage your marketing strategy more effectively.
From the base models to the most advanced
The basic techniques for making forecasts are called naïve forecasts.
They are simple but surprisingly effective.
Naïve Forecast, repeat the last observed value.
Mean Forecast, use the average of previous values.
Seasonal Naïve, repeat what happened during the same period in the previous year.
More complex models, such as ARIMA, Prophet, or neural networks like LSTM, can capture more intricate patterns, but they do not always lead to better performance. If a simple model works well, it is often the best choice.
Evaluating the quality of a prediction
To understand how much a model is wrong, we use several accuracy metrics. The most common ones are:
MAE (Mean Absolute Error), measures on average how far the predictions deviate from the actual values.
RMSE (Root Mean Squared Error), similar to MAE, but penalizes larger errors more severely.
MAPE (Mean Absolute Percentage Error), expresses the average error as a percentage of the actual value.
In general, lower scores indicate better forecasts, but the “best” model always depends on the context.
For example, MAPE can become unreliable when actual values are close to zero, while RMSE can exaggerate the impact of a single large error.
A good model should not only fit the past well, but also generalize to data it has never seen. For this reason, performance is evaluated on a test set, meaning data that come after the training period.
If a simple model, such as the Seasonal Naïve, achieves similar or better results than a complex neural network in terms of MAE or RMSE, then the simpler solution is likely the most effective and, above all, the most interpretable.
Forecasts often include shaded areas around the main prediction line, called confidence intervals. These show the margin of uncertainty and remind us that forecasting is not about guessing an exact number, but about estimating a plausible range of future values.
As with the weather, it is much easier to predict what will happen tomorrow than three months from now. Short-term forecasts are generally more reliable because they are based on patterns that are still stable, while long-term forecasts are riskier: trends can change, seasonality can break down, and new unforeseen factors can emerge.
Exceptional events, such as the 2008 financial crisis or the 2020 pandemic, are examples of blackswans, unpredictable situations that can disrupt historical data and temporarily make models ineffective.
In these cases, deciding whether to include or exclude such periods in the training process is not just a statistical choice, but also a business decision. Keeping that data may introduce distortions, while removing it risks ignoring important lessons.
Ultimately, a good forecast is not the one that is “exact,” but the one that is usefullyaccurate, reliable enough to guide real decisions while recognizing that uncertainty will always be part of the future.
Ready to turn your data into forecasts?
Dhiria’s mission is to make predictive analytics more accessible and useful for companies that want to base their decisions on data.
With TIMEX, you can analyze and forecast your time series, identify patterns and trends, and generate reliable predictions without technical complexity.
👉 Discover how TIMEX can support your forecasting needs.
Visit www.dhiria.comor contact us at info@dhiria.com for a personalized demo.